MARSHALL SCHOOL TEAM A STATISTICS PROJECTS
Class of 2018
College Rankings (USA)
PHASE 1
Determine correlation between the key factors (variables) and our our goal, School Rankings


PHASE 2
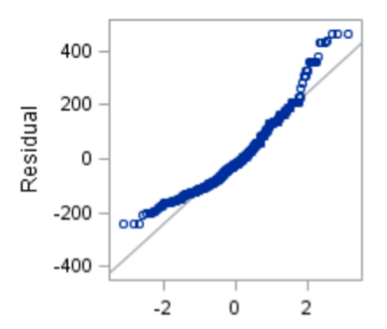
Using predictive analysis, we used linear regression to create an equation that can be used to predict future school rankings; with this equation, USC can make smarter decision when utilizing their resources.

PHASE 3
Another predicative analysis we performed was to help USC to understand what are the most important factors in the data set and how would they influence each other to result in different rank.
We found out that if USC increase the number of international students, the rank can be higher.
We also found, surprisingly, that if USC student’s party more, the ranking may also trend higher (this element requires more analysis, but, an interesting point none the less.

International Students
Party School

PHASE 4
Next, we helped USC to answer the following question using binary logistic regression.
“Does school ranking really have to be in top tier of citation, research and teaching in order to be one of the top 50 school world wide?”
The answer is YES; with a very strong correlation

PHASE 5
Then the next question we helped to answer was
“What areas factors school should excel in order to become top tier in citation, teaching and research”?
The answers were:
-
Number of students
-
Percent of undergrad
-
Student-staff ratio
-
Gender ratio
-
International students ratio


Citation
Teaching
Research

PHASE 6
We needed to determine the "sweet spot" for each of the 5 new variables. Prestige worldwide used neutral network predictive modeling within SAS! (that just happened!)
The accuracy of the model is between 88% ~ 93%

PHASE 7 - Recommendations
Recommendations – ordered by priority
-
Increase international students from 20% to 26.5% or more
-
Maintain current female male ratio and keep above 2:5
-
Maintain current number of students and don’t fall below 34,316
-
Maintain current % of undergrads and don’t exceed 63.5%
-
Lower student to staff ratio from 12.9 to 9.1
Honorable Mention: Party More (which may have a relationship to winning more football games)
PHASE 9 - Next Steps
Recommend follow-on goals and data analysis and modeling that would build on the results
It appears that international students are very important; next step is to understand more on how international students relate or influence teaching, citation and research.
It also appears that top-ranked schools accept more male than female students; it would be interesting to find out the reason
Discuss if the project were to be done over again, what changes would be recommended
Collect more detailed academic-related independent variables for better insight into how academic programs may affect the ranking
It is interesting to see that our findings are in line with other ranking profiles. Please visit this link to see other results.
PHASE 8 - Automation
Using SAS built-in programming capability to convert common tasks to re-usable macros with parameters, then write scripts to automate the process


Data cleaning and normalization
