MARSHALL SCHOOL TEAM A STATISTICS PROJECTS
Class of 2018
Music Billboard Top 100 Prediction
PHASE 1 - GOAL
-
Create a predictive model to determine whether a song will make to the top of the list on billboard
-
Decompose soundtracks into several attributes and characteristics such as loudness, tempo, etc.
-
Combine with 40 years of billboard ranking data and perform predictive data analysis
-
Develop a proposal to music industry on which factors have most influence on rankings, and which factors are most detrimental to their rankings
DATABASES USED & JOINED
http://www.billboard.com --> for ranking
(Data set includes all more than 1 million decomposed audio files and 40 years of top 100 weekly ranking)
http://labrosa.ee.columbia.edu/millionsong/ --> for song characteristics
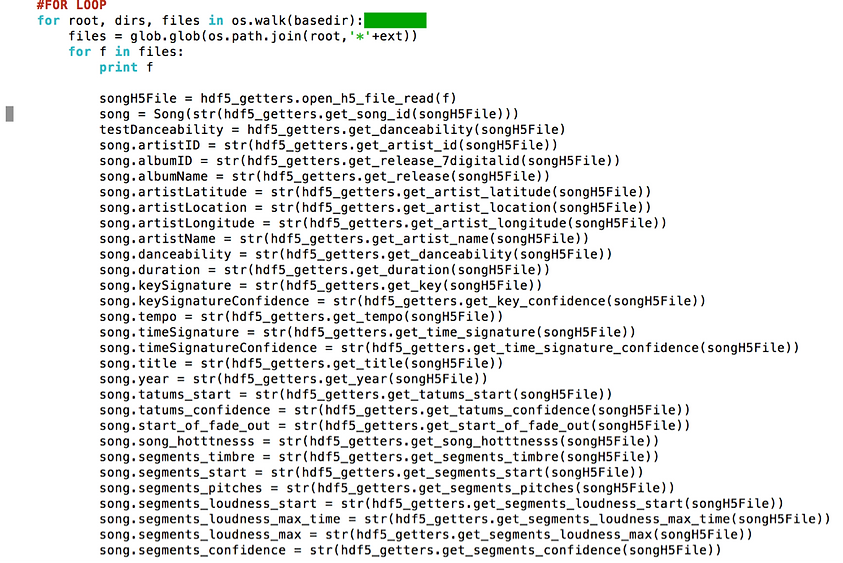
PHASE 2 -- Data Conversion
Data collection scripts
The data structure of the Million Song Dataset is a more complex and difficult database. The conversion was not efficient so we ignored certain variables. We focused (for this project) on the high level attributes such as tempo, loudness, key, time, etc (as shown below).
PHASE 3 -- Review the Data
The data points we have did not yield meaningful results; although it is statistically significant, the R-Square is less than 1%
PHASE 4 - Next Steps
We need to do a few basic changes/manipulations to the data; first, we need to create more segmented genres and then use more of the variables (attributes) that are generated after analyzing a song -- we are only scratching the surface..
Our goal is to further analyze the algorithms for MP3 decomposition, add genre segmentation to each song and then refine our predictive engine so that we can, in real-time, rip an MP3, analyze it against "known good variables" and offer advice to song writers.


MILLION SONG DATABASE ATTRIBUTE DEFINITIONS


Normalization & clean up for JOIN

STATS OVERVIEW

However, we found that if we add “Song Hotness” and “Streak” as the independent variable, the model became more accurate; both linear regression and RPM.
We decided to look into “Song Hotness” and "Streak" a bit more...


Song Hotness is generated by an algorithm developed by echonest / Spotify -- it takes the meta data, assigns different weights to each data point, then computes the likelihood of the song becoming popular (or not). We analyzed the algorithms to determine (used by en/S) that the data was relevant to our project and their was no extraneous data points.
Since "Streak" (the number of weeks in a row on the Charts) plays a big role in predicting the rank, we modified our goal to find the relationship between the data we have and the "Streak".
Using linear regression, again, we achieved statistically significant results -- but -- not accurate enough.

Using ANOVA

Although the model is statically significant, most of the difference of least square means are not. We found a few combinations that are statically significant.
For example, if the algorithm determined that your song hotness score is not higher than 70 (out of 100), (AND) your song has fast tempo, (AND) normal loudness and duration, you will want to slow it down and you might be able to increase your streak to by up to 15 weeks
We discovered through our analysis process that we would need to categorize every song into a GENRE to get more meaningful results. To continue with our current data set we needed to create a pseudo-Genre table, assigning a TYPE variable (in Hex) so that SAS could make calculations --
pseudo-Genre Table
Using RPM
The training curve looks great but the validation is low; this might have something to do with the amount of data that we have since after duplication and consolidation, we have roughly 2000 rows of data.
The selected model was Ensemble_Champion


Typical graphical representation of MP3 Song with good Song Hotness and long Streak variables.
